Mcp System Monitor
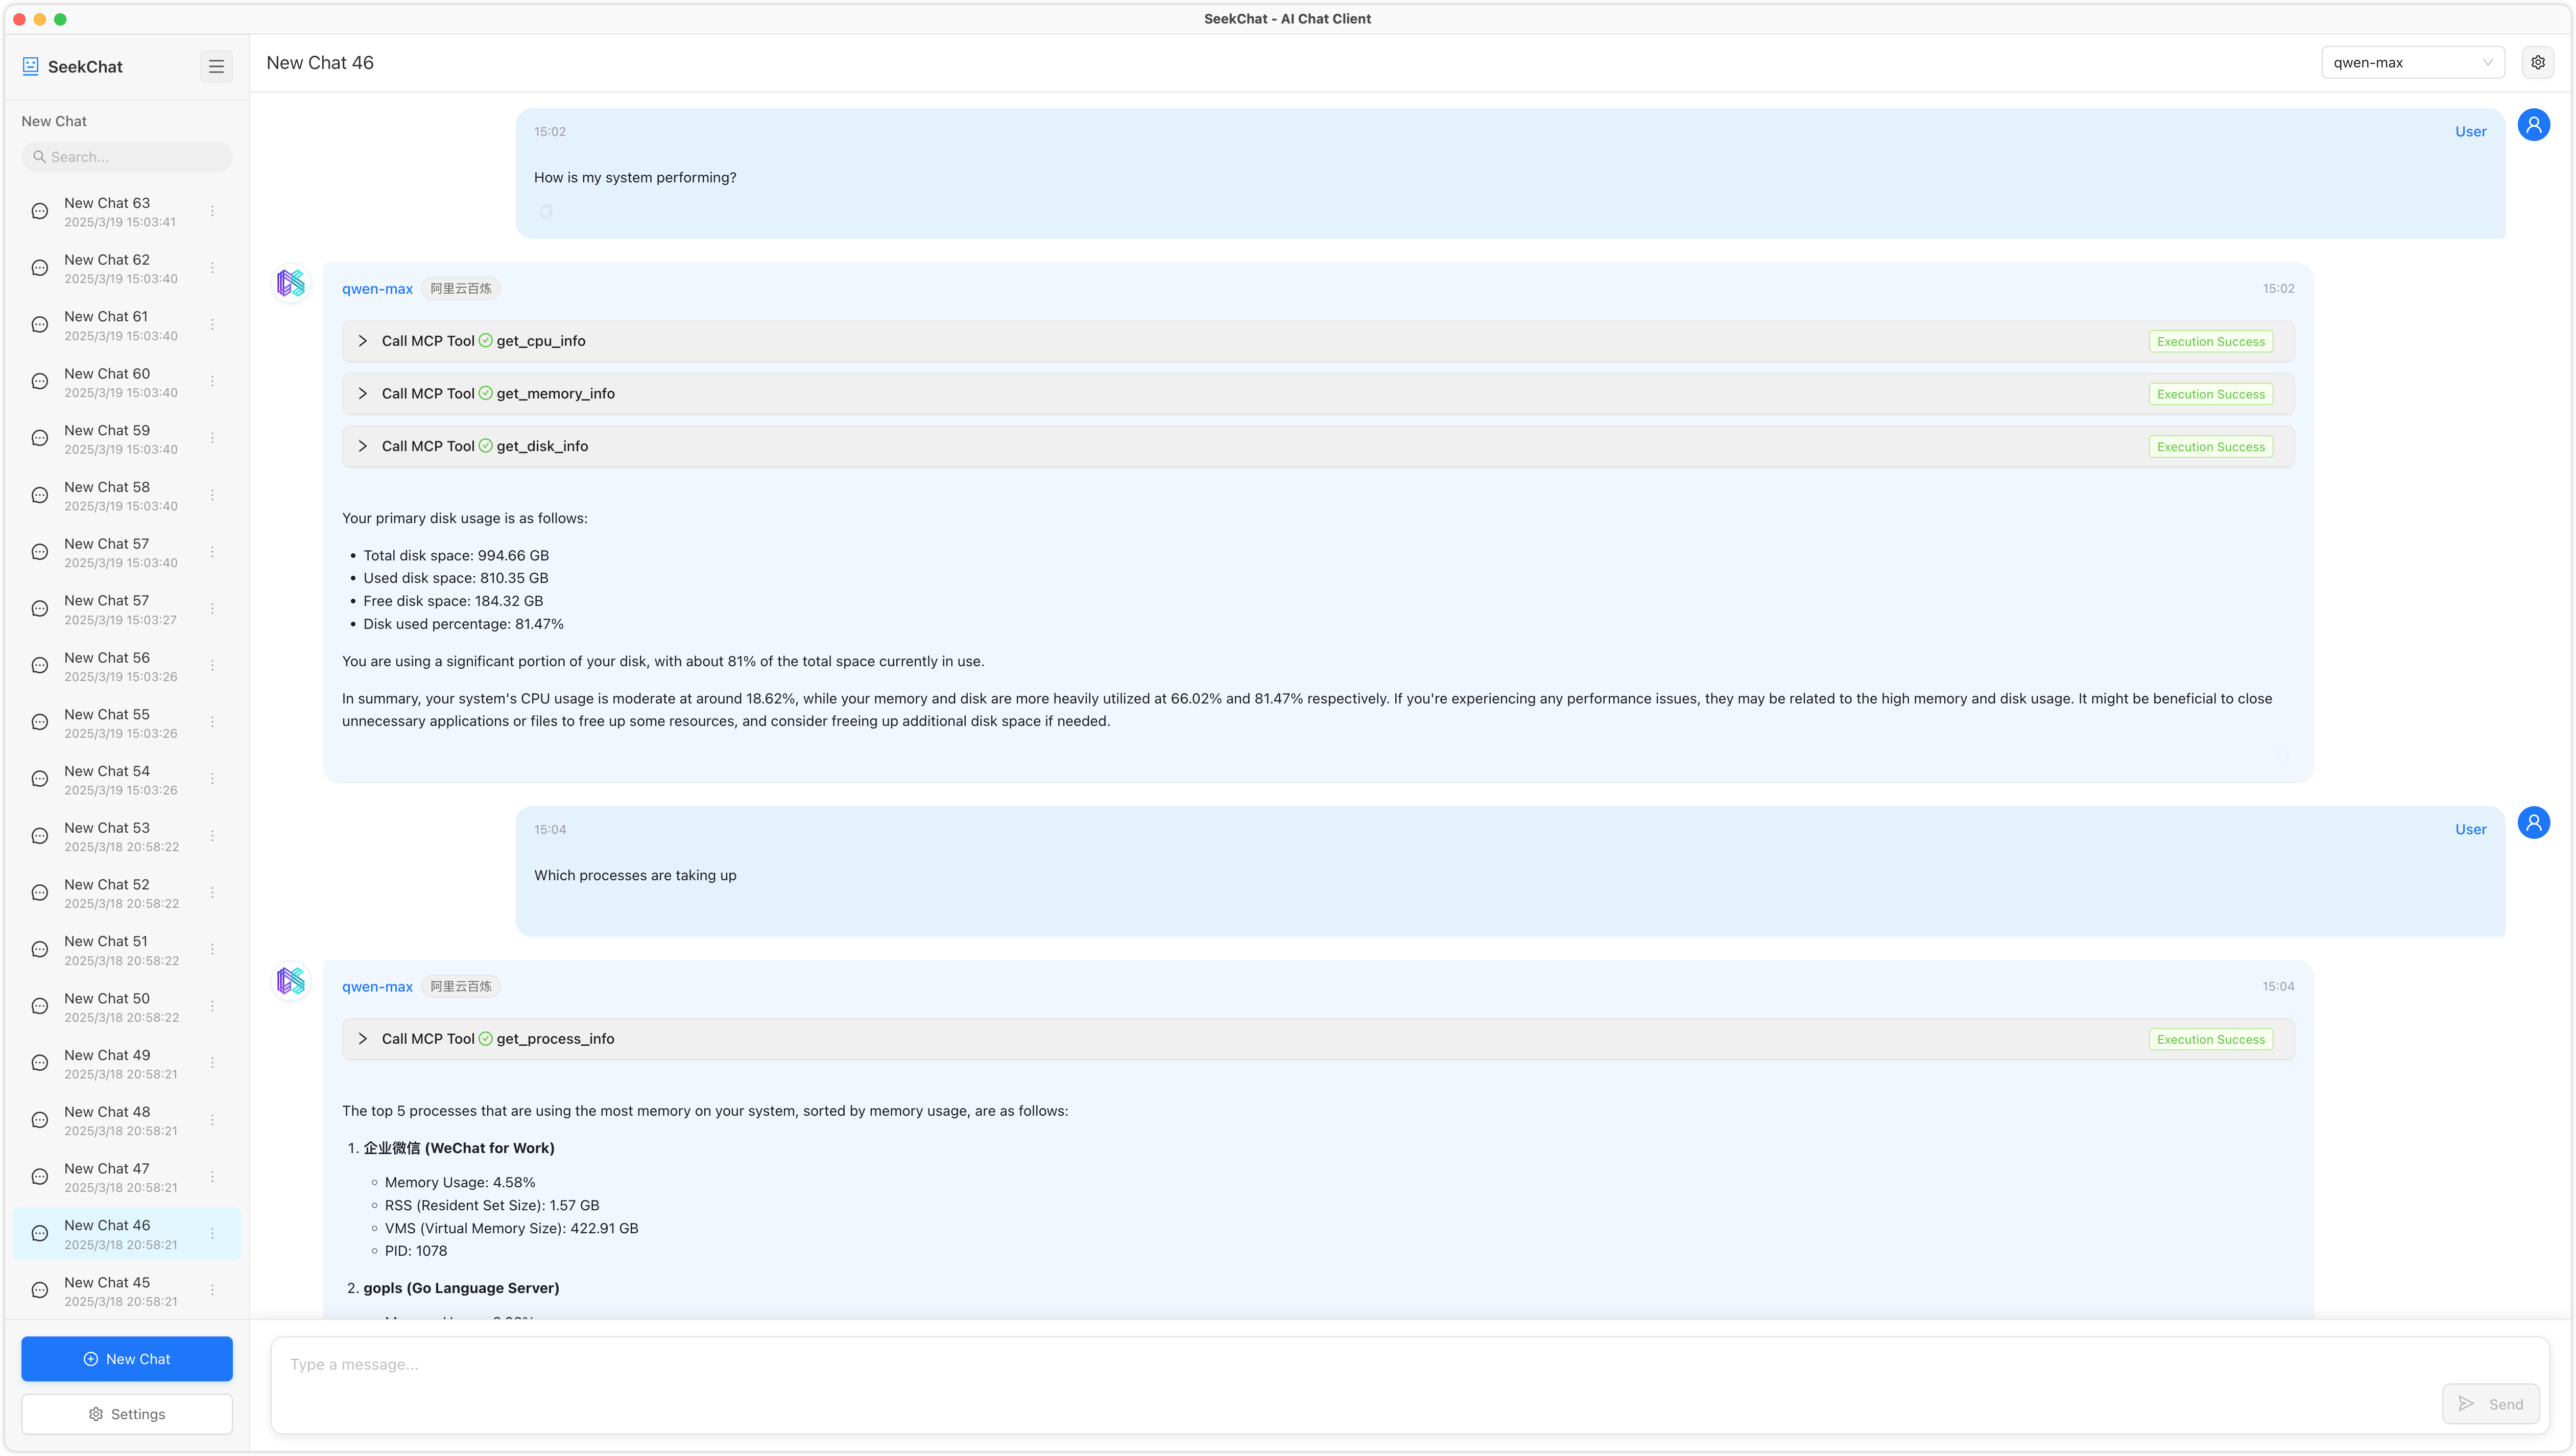
A system monitoring tool that exposes system metrics via the Model Context Protocol (MCP). This tool allows LLMs to retrieve real-time system information through an MCP-compatible interface.
Overview
What is MCP Monitor?
MCP Monitor is a powerful system monitoring tool designed to expose system metrics through the Model Context Protocol (MCP). This innovative tool enables Large Language Models (LLMs) to access real-time system information via an MCP-compatible interface, making it an essential resource for developers and system administrators who need to monitor and optimize their systems effectively.
Features of MCP Monitor
- Real-Time Metrics: MCP Monitor provides real-time insights into system performance, allowing users to track various metrics such as CPU usage, memory consumption, and disk activity.
- MCP Compatibility: The tool is fully compatible with the Model Context Protocol, ensuring seamless integration with LLMs and other applications that utilize this protocol.
- User-Friendly Interface: MCP Monitor features an intuitive interface that simplifies the process of monitoring system metrics, making it accessible for users of all skill levels.
- Open Source: Being an open-source project, MCP Monitor encourages community contributions and allows users to modify the tool to suit their specific needs.
- Notifications and Alerts: Users can set up notifications to receive alerts when certain thresholds are met, ensuring proactive management of system resources.
How to Use MCP Monitor
- Installation: Begin by downloading the MCP Monitor from the official repository. Follow the installation instructions provided in the documentation to set it up on your system.
- Configuration: After installation, configure the tool to connect with your system's metrics. This may involve setting up the MCP interface and defining which metrics you wish to monitor.
- Monitoring: Once configured, you can start monitoring your system metrics in real-time. The dashboard will display various metrics, allowing you to analyze performance and identify potential issues.
- Integration with LLMs: If you are using LLMs, ensure that they are configured to communicate with MCP Monitor. This will enable them to retrieve system information as needed.
Frequently Asked Questions
Q: What is the Model Context Protocol (MCP)?
A: The Model Context Protocol (MCP) is a communication protocol that allows applications, particularly LLMs, to access and exchange contextual information about the system they are running on.
Q: Is MCP Monitor free to use?
A: Yes, MCP Monitor is an open-source tool, which means it is free to use and modify.
Q: Can I contribute to the MCP Monitor project?
A: Absolutely! Contributions are welcome. You can contribute by reporting issues, suggesting features, or submitting code improvements via pull requests on the official repository.
Q: How can I get support for MCP Monitor?
A: For support, you can visit the official chat at seekrays.com/chat or check the documentation provided in the repository for troubleshooting tips and guidance.
Q: What license does MCP Monitor use?
A: MCP Monitor is licensed under the Apache-2.0 license, allowing users to use, modify, and distribute the software under certain conditions.
Details
Server Config
{
  "mcpServers": {
    "mcp-monitor": {
      "command": "docker",
      "args": [
        "run",
        "-i",
        "--rm",
        "ghcr.io/metorial/mcp-container--seekrays--mcp-monitor--mcp-monitor",
        "./out"
      ],
      "env": {}
    }
  }
}Mcp System Monitor Alternative
For some alternatives to Mcp System Monitor that you may need, we provide you with sites divided by category.
